Projects
Biospectroscopy
High-throughput FTIR-spectroscopy of body fluids
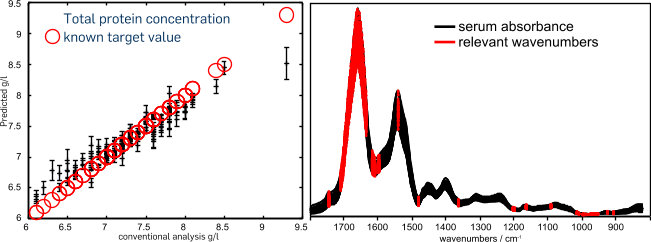
The infrared absorbance spectrum of a body fluid – blood, urine, cerebrospinal fluid etc. – represents the actual biochemistry of the contained substances. With a multivariate quantitative analysis, concentrations of key substances can be determined in analogy to classical clinical chemistry.
The biophotonic research on body fluids of PURE aims at biomarker relevant spectral features particularly for oncologic and neurodegenerative diseases. The quantitative determination of single substances is not necessary. Instead, spectral marker patterns for the discrimination of healthy and diseased patients are identified based on the sampled biochemical fingerprints. Data analysis is performed with dedicated bioinformatics, supporting identification and validation.
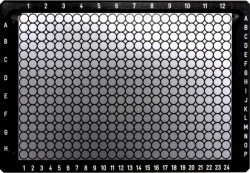
In contrast to the analysis of tissue samples, only one representative spectrum can be acquired of each patient and body fluid sample. To reliably and reproducibly analyze a high number of samples, a high throughput FTIR-spectrometer system was established. By extensive automation of all procedures, the key steps of preparation, acquisition and analysis are performed without user influence. The required supreme spectral reproducibility is achieved by a novel sample preparation (Ollesch et al., 2013).
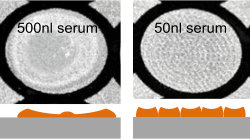
A drop of highly concentrated protein and salt solution, such as blood, dries forming a so called coffee ring. A crater shaped structure is formed, with a high concentration of formerly solved substances at the edge, and a more evenly distributed film in the center. The application of many small droplets minimizes this effect. The small droplets merge forming an FTIR-spectroscopically homogeneous film.
Measurement artefacts are removed from the IR-absorbance spectra by automated preprocessing-scripts. Thereby, subjective user influence on data and the further classification results are avoided.
A primary element of the analysis is the selection of spectral features relevant for classification. By this feature selection, paired wavenumber-intensity data for the optimal differentiation of the analyzed classes are identified. On spectroscopic data, a procedure giving a relevance ranking of data based on the random forest classifier has proved useful.
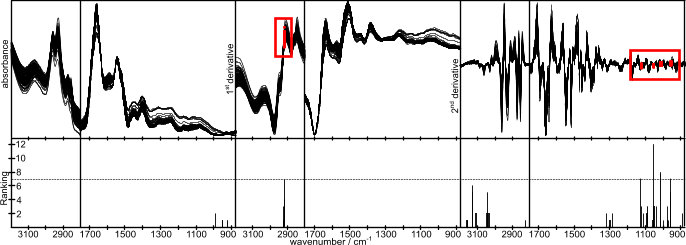
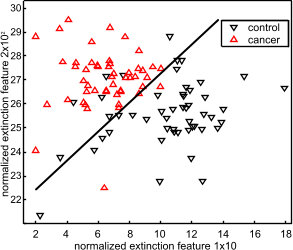
Using this technique, we identified spectral features for the discrimination of histopathologically verified urinary bladder cancer patients from urinary tract infection patients with an accuracy, sensitivity and specificity well above 90 % (Ollesch et al., 2014).
References
Ollesch, J., Drees, S.L., Heise, H.M., Behrens, T., Brüning, T., and Gerwert, K. 2013: "FTIR Spectroscopy of Biofluids Revisited: An Automated Approach to Spectral Biomarker Identification."
The Analyst 138 (14): 4092-102. doi:10.1039/c3an00337
Ollesch, J., Heinze, M., Heise, H.M., Behrens, T., Brüning, T., and Gerwert, K. 2014: " It's in your blood: spectral biomarker candidates for urinary bladder cancer from automated FTIR spectroscopy."
J Biophotonics. 2014 Jan 7. doi: 10.1002/jbio.201300163. [Epub ahead of print]
Durch eine hohe Akzeptanz in der Bevölkerung für eine möglichst nicht-invasive Gewinnung von Körperflüssigkeiten (hier Urin) der direkten tumorösen Umgebung zur Vor- und Nachsorge ergibt sich durch die Spektrale Zytopathologie (SZP), bei der die in den Körperflüssigkeiten enthaltenen Zellen analysiert werden, sowohl ein prädiktiver als auch diagnostischer Zugang, um möglichst frühzeitig sich entwickelnde Tumoren zu erkennen. Herkömmliche zytologische Verfahren beschränken sich hauptsächlich auf Zelluntersuchungen mit dem Lichtmikroskop nach vorheriger Färbung und sind arbeits- und zeitaufwendig bei einer gleichzeitig ungünstigen Reproduzierbarkeit. Wir etablierten mit der SZP auf vibrationsspektroskopischer Basis eine schnelle, einfache und reproduzierbare markerfreie Methode zur Zelluntersuchung an der Entität Harnblasenkarzinom. Ziel hierbei ist es, zwischen verschiedenen Zelltypen und zwischen „gesund“ und „krank“ zu unterscheiden.
Mit Hilfe der IR-Spektroskopie und nachgeschalteter bioinformatorischer Methoden können so die verschiedenen Zelltypen und jeweils die „gesunden“ von „kranken“ Zellen mit einer Auflösung von ~2,7 µm anhand ihres biochemischen Zustands differenziert werden. Um subzelluläre Komponenten verschiedenster Zelltypen räumlich spektral aufzulösen, näher zu charakterisieren und Zelltypen aufgrund ihrer Morphologie unterschieden zu können, werden sie durch die Raman-Spektroskopie, die eine höhere Auflösung (~300 nm) hat, analysiert.
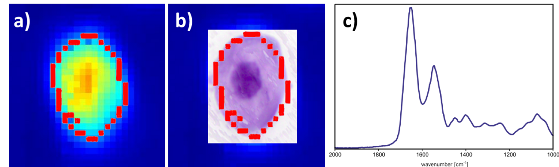
Automatisierte Zellerkennung: a) spektrale Identifizierung einer Zelle anhand der Intensität der Proteinkonzentration (je röter, desto mehr Protein) und Abgrenzung vom Hintergrund (rote Linie); b) automatische Überlagerung der im spektralen Bild erkannten Zelle (rote Linie) und der gefärbten Zelle; c) gemitteltes und korrigiertes Spektrum der Zelle zur bioinformatorischen Weiterverarbeitung.
High-Throughput FTIR-spectroscopy
- Bruker Vertex 70v Vacuum-Spectrometer
- HTS-XT 384 well Multi-well-titerplate reader
- „Twister“ Titerplate changer
- Vertex 70v equipped with MicroBiolytics MIU Semiautomatic flowcel
- M2 Automation iTWO robotic dispenser
Conventional FTIR-Spektroscopy
- 4 Bruker Vertex 80v Vacuumspectrometers, Stepscan- and ATR-equipment
- Bruker Vertex 70
- Bruker Alpha, equipped with diamond-ATR-cell
- Bruker IFS 66v/s
- Bruker IFS 66v
- Bruker IFS 66
- Bruker IFS 88 equipped with Smiths Detection DuraSamplIR diamond-ATR-cell
Laser
- Lambda Physik LPX 200
- Lambda Physik LPX 300
- Lambda Physik LPX pro
- Spectra Physics Quanta Ray
Dr. Julian Ollesch (High-throughput FTIR-spectroscopy)
Dr. Sven Brucker (Spectral Cytopathology)